Food App Business Analysis
Project Information
- Category: Data Analytics / Business Intelligence / Customer Engagement
- Client/Context: Quantum Analytics
- Project Date: November 2023
- Tools Used: Power BI (Power Query, DAX)
- Data Source: Quantum Analytics
- Project URL: View Live Dashboard (If available)
Food App Business Analysis: Driving Customer Engagement and Growth
Summary
This project addresses a critical challenge faced by an online food app business: optimizing customer engagement for sustained growth. My objective was to leverage Power BI to perform robust exploratory analysis, providing actionable business insights and data-driven proposals to enhance customer engagement and accelerate business growth. The dashboard offers a comprehensive view of key performance indicators, customer demographics, sales by category, campaign effectiveness, and discount deal impact, enabling strategic decision-making for both business and technical stakeholders.
1. Introduction: The Imperative of Customer Engagement in Online Food
In the highly competitive online food business, sustained customer engagement is paramount for growth. This project was initiated by an online food app company to adopt a data-driven approach to understand and improve its customer engagement, aiming for sustainable growth. The primary focus was to dive deep into their customer data, identify key drivers of purchasing behavior, and pinpoint areas for strategic intervention. The ultimate goal was to translate raw data into clear, actionable insights that would directly contribute to increased customer satisfaction, loyalty, and overall business expansion.
2. Project Objectives & Goals
The core objectives for this Power BI project were defined to provide comprehensive insights for enhancing the food app business:
Overall Objectives:
- To perform robust exploratory analysis of customer data to uncover hidden patterns and trends.
- To generate actionable business insights regarding customer behavior and engagement.
- To propose data-driven strategies to add significant value to customer engagement and business growth.
Project Goals & Deliverables:
- Overall Business Performance Overview: Display key metrics like Total Amount Spent, Sum of No of Purchases, Average of Monthly Income, Consumer Complaints, and Total No of Customers.
- Income and Purchase Analysis by Age Group: Visualize the sum of monthly income and purchasing patterns across different age demographics.
- Sales by Product Category: Break down total sales by food category (e.g., Sweet, Fish, Fruits, Gold, Meat, Wines) to identify popular items.
- Purchase Channel Analysis: Compare customer purchases across different channels (StorePurchase, WebPurchase, CatalogPurchase).
- Campaign Effectiveness Analysis: Evaluate the performance of different marketing campaigns (1st to 5th Campaign) in terms of customer engagement.
- Customer Engagement by Discount Deals: Analyze the number of customers based on the number of deals with discounts to understand price sensitivity.
- Demographic Filtering: Enable filtering by Age Group, Graduate status, and Marital Status for targeted analysis.
3. Data Scope & Metrics
Key Data Points & Metrics Captured and Displayed:
- Total Amount Spent by Cusomers: $1.34M
- Sum of No of Purchases made by Customers: 28K
- Average of Monthly Income of Customers: $51.62K
- Consumer Complaints: 20
- Total No of Customers: 2205
- Sum of Monthly Income by Age Group of Customers: Forties ($33M), Fifties ($28M), Sixties ($27M), Thirties ($15M), Seventies ($8M), Twenties ($2M).
- Total Sales by category: Sweet (58.45%), Gold (27.24%), Fish (6.22%), Fruits (4.47%), Meat (4.35%), Wines (?).
- StorePurchase, WebPurchase and CatalogPurchase: StorePurchase (13K), WebPurchase (9K), CatalogPurchase (6K).
- Total No Customers by Campaignn: 1st Campaign (142), 2nd Campaign (30), 3rd Campaign (163), 4th Campaign (164), 5th Campaign (161).
- Total No of Customers by NoOfDealsWithDiscount: A significant number of customers (957) have 0 deals with discount, followed by smaller numbers for higher discount deals.
Key Insights Derived from Data (Pre-Dashboard):
- Customers in their Forties, Fifties, and Sixties represent the highest income and likely spending segments, indicating these demographics should be a primary target for marketing efforts.
- "Sweet" category products dominate sales at 58.45%, indicating high demand and potential for further exploration into specific sweet items.
- Store purchases are the most common channel (13K purchases), followed by web (9K) and catalog (6K) purchases, suggesting a strong physical presence or a preference for in-person transactions.
- The 2nd Campaign significantly underperformed with only 30 engaged customers compared to other campaigns (e.g., 4th Campaign with 164 customers), which warrants a detailed review of its strategy and execution.
- A large segment of customers (957) do not utilize discount deals, suggesting that either the discounts are not appealing, or a significant portion of the customer base is not price-sensitive, which is a crucial insight for pricing and promotion strategies.
- The low number of consumer complaints (20) indicates generally high customer satisfaction, which is a positive sign for the business.
4. Dashboard Design & Key Insights (Based on Visual Analysis)
The "FOOD APP BUSINESS" dashboard was meticulously designed in Power BI to present complex customer and sales data in an intuitive and actionable format.
Dashboard Features and Key Insights from the "FOOD APP BUSINESS" Dashboard:
4.1 Executive Summary & Key Performance Indicators (KPIs)
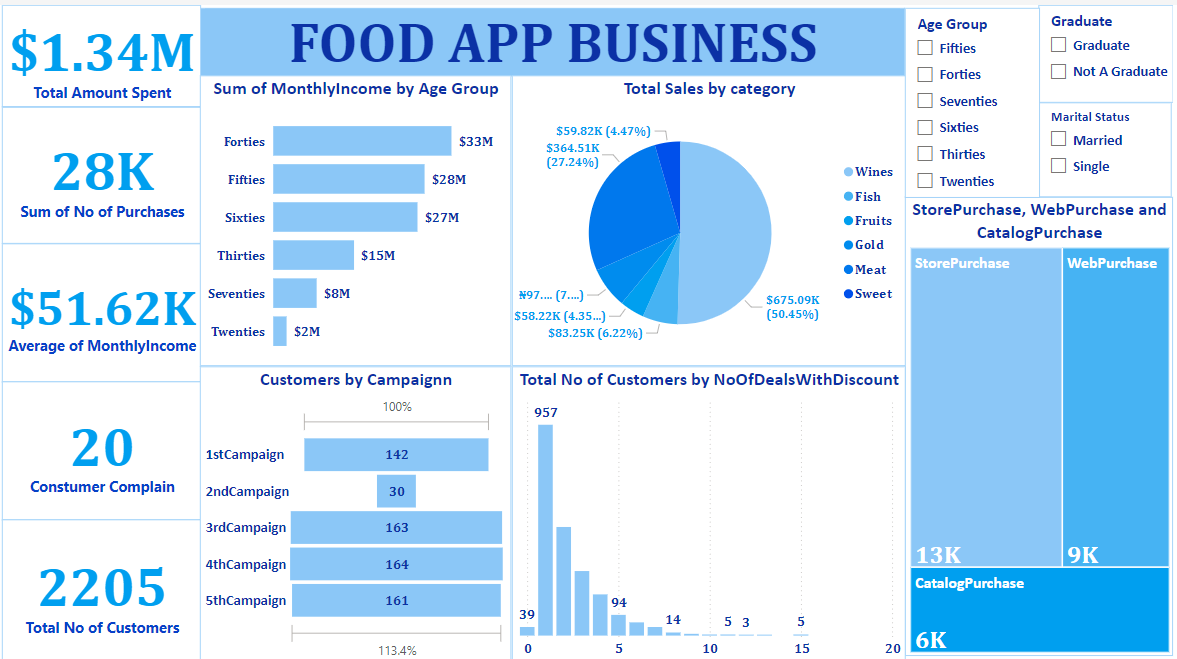
Prominent KPI cards on the left provide an at-a-glance summary of the business's overall performance:
- Total Amount Spent: $1.34M
- Sum of No of Purchases: 28K
- Average of Monthly Income: $51.62K
- Consumer Complain: 20
- Total No of Customers: 2205
These metrics offer an immediate foundational understanding of the company's scale and customer base.
4.2 Customer Demographics & Spending Patterns
- Sum of Monthly Income by Age Group: A bar chart illustrates that customers in their "Forties" have the highest total monthly income ($33M), followed by "Fifties" ($28M) and "Sixties" ($27M). "Twenties" have the lowest at $2M. This highlights the most lucrative age segments for targeted marketing.
- Total Sales by category: A pie chart shows "Sweet" products dominating sales at 58.45%, with "Gold" (27.24%) as the second largest category. "Fish," "Fruits," and "Meat" contribute smaller but significant percentages. This indicates clear product popularity and potential for cross-selling strategies.
- StorePurchase, WebPurchase and CatalogPurchase: A visual indicates that "StorePurchase" accounts for 13K purchases, "WebPurchase" for 9K, and "CatalogPurchase" for 6K. This suggests that physical store channels still play a significant role alongside online avenues.
4.3 Campaign Performance & Discount Impact
- Customers by Campaignn: A bar chart reveals that the "4th Campaign" (164 customers) and "3rd Campaign" (163 customers) performed best, while the "2nd Campaign" only engaged 30 customers, significantly underperforming others. This provides direct feedback on campaign effectiveness for immediate review and adjustment.
- Total No of Customers by NoOfDealsWithDiscount: A bar chart shows that 957 customers had 0 deals with discounts, while the number of customers rapidly drops for higher numbers of discount deals. This critical insight suggests many customers purchase without needing discounts, or that current discounts are not widely appealing.
4.4 Interactive Filtering
- Slicers: The dashboard includes slicers for "Age Group," "Graduate" status, and "Marital Status." These allow users to segment the data and analyze customer behavior for specific demographics, enabling highly targeted marketing efforts and personalized promotions.
The dashboard's clean layout and interactive elements empower stakeholders to quickly grasp the current state of customer engagement and identify areas for optimization.
5. Technical Approach & Tools
The project followed a robust data analysis and business intelligence workflow using Power BI:
- Data Acquisition & Ingestion: The proprietary food app business data was imported into Power BI Desktop.
- Data Cleaning & Transformation (Power Query in Power BI): Power Query Editor was extensively used for data preparation:
- Ensured data consistency and addressed any missing or erroneous entries across customer and transaction records.
- Transformed and cleaned categorical data (e.g., Age Group, Marital Status) for accurate grouping and filtering.
- Parsed and converted numerical fields (e.g., Total Amount Spent, Monthly Income, Number of Purchases) to appropriate data types for calculations.
- Aggregated data to suitable levels for visualizations, such as summing monthly income by age group or total sales by category.
- DAX (Data Analysis Expressions) Calculations: DAX measures were created to compute key business metrics:
- `Total Amount Spent = SUM(AmountSpent)`
- `Sum of No of Purchases = SUM(NoOfPurchases)`
- `Average of MonthlyIncome = AVERAGE(MonthlyIncome)`
- `Consumer Complain = COUNT(Complaints)` .
- `Total No of Customers = DISTINCTCOUNT(CustomerID)`
- Measures for sales by category, campaign effectiveness, and discount deal analysis were also developed.
- Data Visualization & Dashboarding (Power BI Desktop): The dashboard was designed with a focus on clarity and interactivity:
- KPI Cards: Used for prominent display of total spent, purchases, income, complaints, and customers.
- Bar Charts: Utilized to compare income by age group, purchases by channel, and customers by campaign and discount deals.
- Pie/Donut Chart: Implemented for visualizing sales distribution by category.
- Slicers: Provided interactive filtering capabilities by Age Group, Graduate status, and Marital Status.
- Publishing & Sharing (Power BI Service): The final interactive report was published to the Power BI Service, enabling wider access and collaborative decision-making.
6. Impact & Business Value
This Power BI dashboard for the food app business delivers substantial business value by:
- Targeted Marketing & Sales Strategies: By identifying the highest-income age groups (Forties, Fifties, Sixties) and popular product categories (Sweet), the company can tailor marketing campaigns and product offerings to maximize revenue from key demographics.
- Optimized Campaign Performance: The clear visualization of campaign effectiveness, especially the underperformance of the 2nd Campaign (30 customers), allows for immediate review and adjustment of future marketing initiatives, ensuring better ROI.
- Improved Customer Engagement & Retention: Understanding purchasing channels (StorePurchase is highest at 13K) and the impact of discount deals (957 customers without discounts) enables the company to refine its engagement strategies, potentially by offering more personalized promotions or optimizing channel-specific customer journeys.
- Data-Driven Decision Making: The dashboard provides a centralized, interactive platform for business and technical stakeholders to access critical insights, fostering a data-driven culture within the organization.
- Resource Allocation Efficiency: Insights into customer segments and purchasing behaviors can guide resource allocation, from advertising spend to product development, ensuring investments are made where they will yield the greatest return.
- Reduced Customer Complaints: While the current complaint count is low (20), continuous monitoring through the dashboard can help maintain high service quality and promptly address any emerging issues, safeguarding customer satisfaction.
- Identification of Growth Opportunities: Analyzing customer segments by marital status and education level (via slicers) can uncover underserved markets or specific needs, paving the way for new product offerings or expansion strategies.
7. Conclusion
This Power BI project successfully provides the online food app business with a robust analytical framework for understanding and enhancing customer engagement and driving business growth. By meticulously processing and visualizing the provided dataset, the dashboard offers clear, actionable insights into customer demographics, purchasing behaviors, campaign performance, and discount impact. The ability to identify key customer segments and operational bottlenecks empowers the management to make data-driven decisions that will optimize marketing strategies, improve customer satisfaction, and ultimately, ensure the sustainable success of the food app in a competitive market.